Burials vs. Memorials
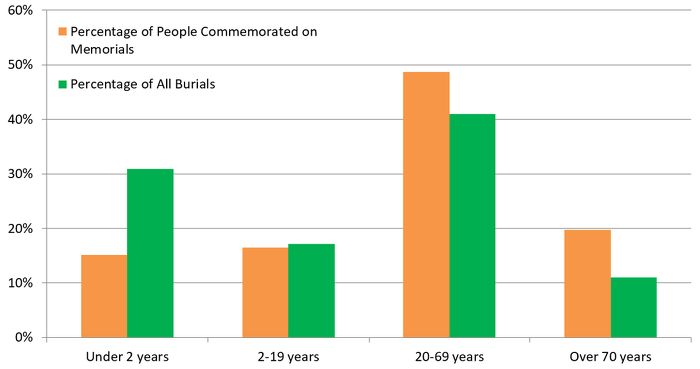
This chart shows the differences between the number of people buried (green) and the number of people commemorated on memorials (orange) by age group. It shows that children are underrepresented on memorials, and adults are overrepresented.
Infants (under 2 year olds) consist of 15% of commemorations, but 31% of all burials.
2 to 9 year olds consist of 9% of commemorations, but 13% of all burials.
10 to 19 year olds consist of 4% of commemorations, but 7% of burials.
Adults (20 to 69 year olds) consist of 49% of all commemorations, but 41% of burials.
Older adults (over 70 year olds) consist of 19% of commemorations, but 11% of burials.
